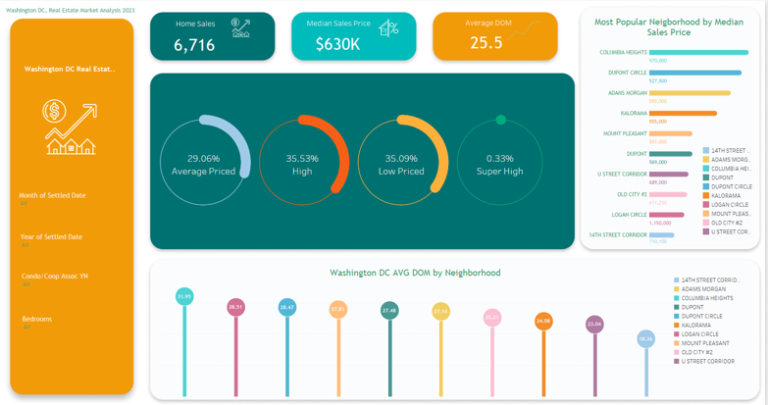
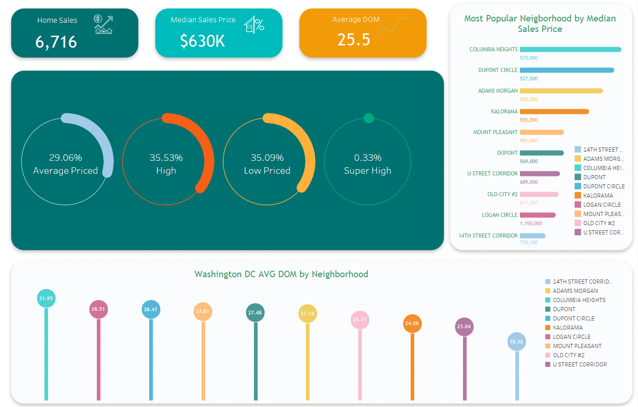
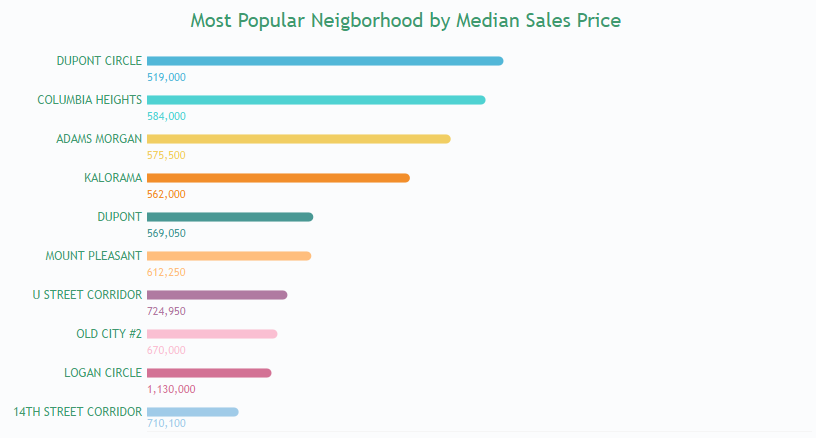
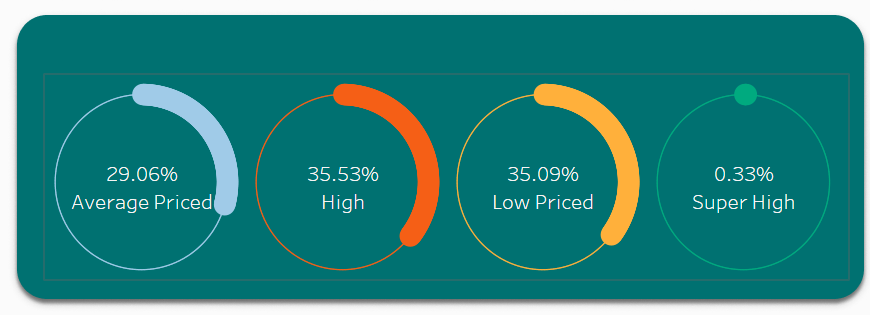
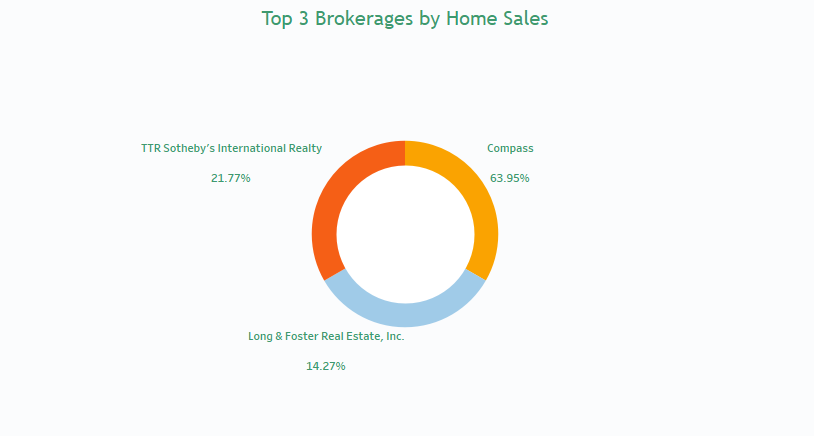
The Tableau Dashboard designed for the Washington DC Real Estate Market Analysis provides a comprehensive exploration of real estate trends within the region from June to December 2023. The initial stage involved meticulous data cleaning using Python, ensuring accuracy and reliability of the data for subsequent analysis. The dashboard integrates various calculated fields created in Tableau to dissect intricate market dynamics.To facilitate the analysis of home sales numbers, categorical data were converted into numeric variables in Python, streamlining subsequent quantitative evaluations.